Project Overview
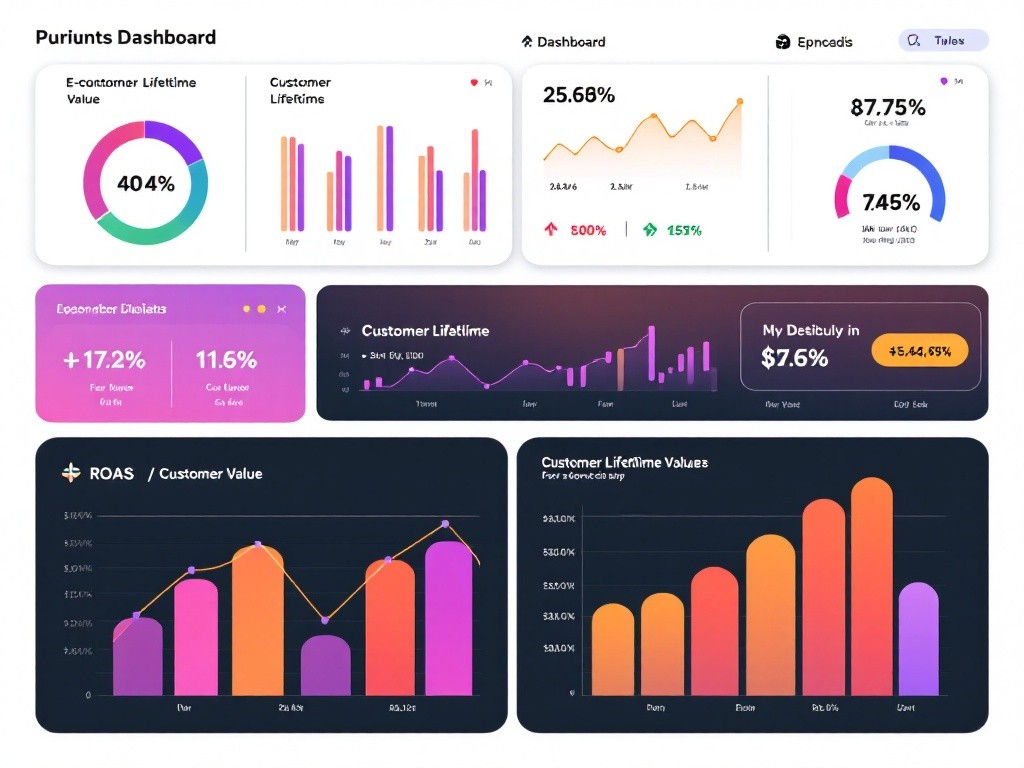
The goal of this project is to create a dynamic and interactive dashboard that visualizes the energy performance of buildings. The dashboard should offer insights into various metrics related to energy consumption, weather conditions, and comfort inside the buildings.
Features and Tasks
Energy Performance Overview:
The dashboard will include energy performance infographics, displaying metrics such as energy consumption in kWh/m²/year, temperature trends, and real-time energy values.
Dynamic Weather and Comfort Data:
Instead of just displaying air quality, the dashboard will incorporate weather conditions such as outside temperature and its trend compared to previous days. This includes showing the temperature trend in degrees Celsius and visualizing the performance of building systems with dynamic gauges.
Building Data Customization:
The dashboard will be flexible, allowing for specific energy data to be calculated based on space usage, such as the aggregation of surface areas for tenant spaces that are currently leased. This will be parameterized to ensure the right data aggregation, even for attributes tied to different tenant groups.
Error Handling and Data Accuracy:
A routine will be implemented to remove outliers and ensure that only valid energy values are considered in the performance metrics. In case of invalid data points, the system will refer to the average values of other valid metrics.
User Interaction with Metrics:
Users will be able to interact with various metrics, such as energy and water consumption rankings. They will also have the ability to make comparisons between tenants, looking at metrics like electricity and water consumption side by side for different tenants, all aggregated to reflect accurate performance data.
Options for Customization
Option 1:
A page dedicated to each building, with individual performance metrics and building-specific images.
Option 2:
A comparison page that allows users to compare energy and water performance across multiple tenants. This will also show metrics for restaurant performance related to energy and water use.
General Considerations
- The dashboard will be flexible to accommodate client-specific data formats and refresh rates, with validation performed on data exchanges.
- The project will also include the integration of a client logo, ensuring the dashboard is customized and branded for the client's needs.


